Hot off the heels of the Splunk .conf25 last week, I thought I’d share some thoughts about the intersection of running AI models at scale and AI model observability. When I first dove into the world of AI at Cisco, I remember sitting in a late-night strategy session, staring at a dashboard full of LLM outputs that were behaving unpredictably. It hit me then: without proper observability, even the most advanced models are like black boxes hurtling through space – powerful, but potentially disastrous if something goes wrong.
“That experience reinforced what I’ve always believed – in AI, visibility isn’t a luxury, it’s the foundation for trust and innovation.”
Drawing from insights like those in recent discussions on LLM monitoring – covering everything from upholding safety standards to optimizing costs – I’m excited to share how Cisco’s acquisition of Splunk is revolutionizing this space. Imagine unlocking real-time insights that not only spot issues, but anticipate them. Today, let’s focus on two practical techniques for AI practitioners like you, building on Splunk’s robust tools to make model observability seamless and actionable.
A Quick Nod to the Why: Building on LLM Monitoring Foundations
As AI practitioners, we know the drill: unmonitored models can lead to hallucinations, biases, or skyrocketing costs from rogue prompts. The conversation around LLM monitoring – think resource metrics like cost per token, token latency that drags user experience with slow output generation, or evaluation scorers like perplexity and factuality – isn’t new.
“With Cisco’s 2024 acquisition of Splunk, we’re not only monitoring, we’re also supercharging it with integrated ecosystems.”
This synergy brings together Splunk’s data prowess and Cisco’s infrastructure smarts, creating a unified platform that’s a game-changer for observing AI models in production.
No more siloed tools held together with duct tape – it’s about holistic visibility that scales. In this post, we’ll skip the basics and dive straight into implementation: starting with OpenTelemetry (OTel) for comprehensive tracing, then exploring Splunk’s HTTP Event Collector (HEC) piped to Splunk Observability Cloud. Along the way, we’ll weave in key metrics like latency and techniques for back-testing model performance.
Technique 1: Implementing Model Observability with OpenTelemetry (OTel)
I’ve always been a fan of standards that cut through the noise, and OTel is exactly that – a Swiss Army knife for observability. Born from the merger of OpenTracing and OpenCensus projects under the Cloud Native Computing Foundation (CNCF), OTel was created to solve the fragmentation in monitoring tools. Before it, teams juggled vendor-specific instrumentation, leading to inconsistent data across systems. Launched in 2019, it’s now a mature, open-source framework that’s vendor-agnostic, supporting languages like Python, Java, and more, with broad industry backing.
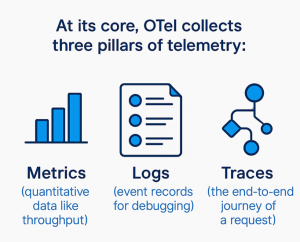
Traces are particularly powerful – they map out spans, which are individual operations in a distributed system, helping pinpoint where a prompt gets stuck in an AI pipeline. For instance, in an LLM inference workflow, a trace might reveal latency spikes from database/RAG retrieval to response generation (TFTT and intertoken latency), directly impacting user experience with sluggish outputs.
Integrating OTel with Splunk is straightforward and potent. You instrument your AI code – say, with a Python SDK – to capture everything: prompt-response pairs, latency metrics, even bias indicators. The OTel Collector then exports this data to Splunk for analysis, where you can visualize traces in dashboards.
- Pros – Otel logs *everything*, giving comprehensive visibility for production environments, like tracing a multi-model chain to catch inefficiencies. See this: Langchain OpenAI example to Observability Cloud
- Cons – In high-volume setups, the overhead from detailed logging can add resource strain, so tune sampling rates.
For real-world AI pipelines, picture this: During development, you might opt for a lighter touch – no full end-to-end traces, just logging prompts and responses for quick A/B testing between models. Use those logs to back-test: Replay queries against alternative models and compare accuracy. In my experience, this has slashed iteration times dramatically. To get started, add a simple instrumentation like –
from opentelemetry import trace; tracer = trace.get_tracer(__name__); with tracer.start_as_current_span(“llm_inference”): …
– minimal code for credible gains.
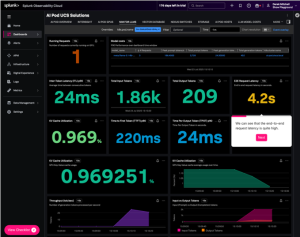
Bonus if you are running your AI workloads on Cisco AI Pods, because the work to implement this for you has already been done. For customers using Splunk Observability Cloud, a prebuilt dashboard has been made available for Cisco AI Pods here: https://github.com/signalfx/splunk-opentelemetry-examples/tree/main/collector/cisco-ai-ready-pods
Technique 2: Using Splunk HEC Collector to Send Data on premises
Shifting gears, sometimes you need flexibility without the full instrumentation heft – that’s where Splunk’s HTTP Event Collector (HEC) shines, especially when funneled to Cisco AppDynamics.
HEC is essentially a secure endpoint for ingesting data over HTTP/HTTPS. You create a token in Splunk, then POST specific debug events or logs – like prompt/response pairs or TFTT / Latency metrics – using tools like curl or libraries in your AI app. For example:
curl -k https://your-splunk:8088/services/collector -H “Authorization: Splunk YOUR_TOKEN” -d ‘{“event”: “AI model latency 2.5ms”}’
“It’s token-authenticated, scalable, and handles structured data effortlessly, indexing it for search and analysis.”
Now, tying this to AppD: Since Cisco’s acquisition, AppD has joined the Splunk Observability family, creating a unified full-stack experience on premises. AppD excels in application performance monitoring (APM), using AI for anomaly detection and root-cause analysis. With integrations like Log Observer Connect, you send HEC-ingested data (e.g., AI model logs) to AppD, where it correlates with business metrics. In an AI context, this means monitoring latency’s user impact – slow generations frustrating interactions – while AppD’s dynamic baselining flags deviations. Compared to OTel, HEC is lighter: great for custom event ingestion, but it lacks OTel’s standardized tracing depth.
In practice, for on-premises dev environments, HEC/AppD is ideal for that lighter touch. Log prompt-responses via HEC, then use AppD or Python scripts to visualize and back-test: Did Model A outperform B on factuality? This setup accelerates A/B testing without production overhead. The synergy?
“Splunk handles massive log aggregation, while AppD adds intelligent insights, like AI-driven alerts on resource spikes.”
And if you have an overenthusiastic developer generating too many tokens on parallel threads – set an alert and implement rate throttling.
Comparing the Two Techniques: When to Choose One Over the Other
Both techniques empower AI practitioners, but context is key. OTel suits production-scale ops needing deep traces for complex, distributed AI systems – think end-to-end visibility in a microservices-based LLM app, where comprehensive logging uncovers hidden bottlenecks. It’s your go-to for metrics like latency tracking across the stack, with the trade-off of setup complexity.
HEC/AppD, conversely, wins in iterative dev cycles: flexible ingestion for quick logging, integrated with AppD’s APM for real-time UX insights. Use it when full tracing feels overkill, focusing on back-testing evaluations without draining resources.
The benefits are –
- Faster debugging
- Cost savings
- Responsible AI through bias detection
In my view, start with HEC for prototyping, scale to OTel for deployment – leveraging Cisco-Splunk’s unified dashboards for the best of both.
Wrapping It Up: The Imperative of AI Model Observability
Reflecting on my journey at Cisco, I’ve seen firsthand how observability transforms AI from risky experiment to reliable powerhouse. It’s absolutely necessary – not just for catching hallucinations or controlling costs, but for building ethical, efficient systems that scale.
“Cisco, through its acquisition and deep synergy with Splunk, is making this easier than ever: unified tools that blend data ingestion, AI agents, and real-time insights.”
The .conf25 event saw Splunk unveil agentic AI innovations in Observability Cloud and AppDynamics, automating troubleshooting and boosting resilience in the AI era. It’s a bold step forward, with features like AI Troubleshooting Agents that analyze issues proactively. But this is just the beginning of what’s possible.
Ready to dive in? Try this interactive demo. It demonstrates these techniques hands-on to show you how they fit your workflow. Until I post again, I’d love to hear your perspectives in the comments – what’s your biggest observability challenge in AI?
#CiscoAI #SplunkObservability #AIModelMonitoring #SecuredAI


