In part 2 of our 3-part blog series, we dove into the technical and operational requirements of a hypothetical application called Workload Carbon Optimizer (WCO). Now, in this third and final part, we will discuss in greater detail the potential functional architecture design validated by Cisco engineers in an internal proof of concept (PoC). This architectural deep dive aims to arm developers with insights and detailed considerations based on our proof-of-concept work, offering a roadmap for tackling the challenges outlined in our previous discussions.
WCO Functional Design Architecture: Technical Deep Dive and Capabilities The primary focus of WCO is to optimize workload operational greenhouse gas (GHG) emissions by creating a modular telemetry pipeline. This pipeline consists of components that collect necessary workload and energy data, calculate GHG emissions, and provide visibility, reporting, and forecasting capabilities.
Visibility
At the heart of WCO is the GHG emissions visibility system. This system transforms data from workload resource usage to calculated energy consumption, before ultimately estimating workload GHG emissions. The final carbon equivalent GHG emissions estimates are calculated using the following formula:
Workload operational estimated GHG emissions “CO2e” = operational GHG emissions “CO2e”+ embodied GHG emissions “CO2e”
Where:
Operational GHG emissions =
a. (resource usage [%]) x
b. (energy conversion models [kWh]) x
c.(power usage effectiveness (PUE)) x
d. (power grid emissions [grams CO2e / kWh])
Embodied GHG emissions = Estimated metric tonnes CO2e emissions from the manufacturing of data center servers and equipment.
Let’s expand on each of the operational emission variables:
Resource Usage
WCO needs to provide two approaches for resource usage collection: an agent-based Open Telemetry collector and a Cloud billing API collector. When applicable, an agent-based collector should be used for finer-grained resource usage monitoring and distributed topology detection. This component populates the pipeline with infrastructure resource usage for compute, memory, storage, networking, and Virtual Machine (VM) instances. Additionally, it provides workload resource usage metrics for containers, Kubernetes Pods, and all Kubernetes replication set variations, utilizing distributed tracing to aggregate resource usage from all workloads.
Energy Conversion Models
With the pipeline populated with resource usage, the WCO visibility module must convert infrastructure usage or load to energy consumption (kWh). To achieve this conversion, we build upon a software metering approach outlined by Teads sustainability engineering tech blog and their respective citations. This approach utilizes Intel RAPL to profile energy use for Intel-based bare metal instances under various stress/load levels. These profiles can be applied to virtual machines by adjusting for the ratio of bare-metal vCPU to VM vCPU. Although we have questions regarding the generalizability of this approach, it provides a granular model of energy conversion.
Power Usage Effectiveness
Once energy estimates are calculated, the system evaluates the efficiency of compute, storage, and networking IT equipment or power usage effectiveness (PUE). We utilize PUE coefficients reported by cloud providers and cloudcarbonfootprint.org. Future iterations of the system might implement a more granular approach when applicable.
Power Grid Emissions
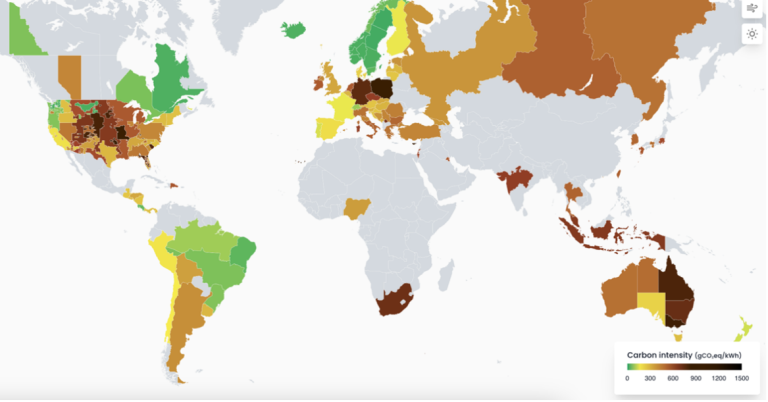
The final pipeline component is the power grid emissions exporter, responsible for determining the GHG emissions associated with electricity generation. WCO could implement this component with power grid carbon intensity data from sources like Electricity Maps, retrieving GHG emissions metrics on a per-region basis with a refresh interval of one hour. Additionally, partnerships with industrial electricity switchboard vendors and OT power management vendors can provide a localized view of carbon intensity, accounting for privately generated renewable energy or purchased renewable energy.
Let’s expand on the embodied emission variable:
With all pipeline components implemented, the WCO visibility module can estimate compute infrastructure and software workload operational GHG emissions on an hourly basis. These operational GHG emissions can be used to optimize hybrid cloud applications. We intend to follow the Green Software Foundation specifications for calculating embodied GHG emissions and leverage datasets reported by cloud providers.
Reporting and Compliance
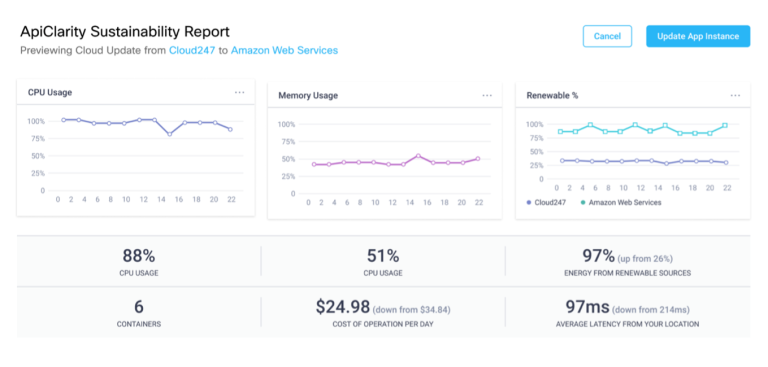
Aggregating workload and application GHG emissions metrics, the WCO module can provide granular reports of carbon equivalent emissions over time. These reports can enable application developers and IT leaders to make informed sustainability decisions and meet emission goals.

Forecasting and Planning
In addition to visibility and reporting, a WCO module would provide optimized workload scheduling capabilities. Utilizing forecasted carbon intensity data, the system analyzes trends in data center carbon emissions equivalent to suggest optimal workload schedules.

The scheduling algorithm is designed to minimize workload carbon emissions and any additional user-provided metrics such as infrastructure cost and performance. We define two optimization scenarios: single host temporal scheduling and multi-host regional scheduling.
- Single Host Temporal Scheduling: Applicable for job-based workloads scheduled at intervals, such as Linux or Kubernetes cron jobs. This algorithm computes optimal runtimes within a single host region to minimize carbon emissions by shifting workload energy usage to align with periods of minimal carbon intensity.
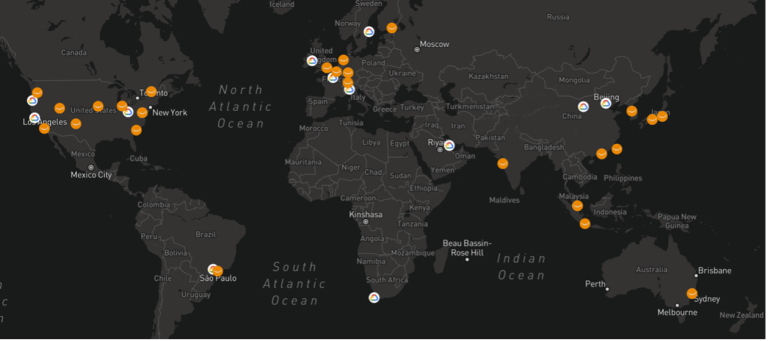
- Multi-host Regional Scheduling: For hybrid and multi-cloud scenarios, the system suggests optimal data center locations over time, effectively migrating workloads to regions with minimal carbon intensity. Insights from WCO may also provide indicators for data center locations or expansions.


Closing Thoughts and Call to Action
Sustainability is now a key item on the Enterprise risk dashboard, and businesses are rapidly creating digital services in a multi-cloud world. It’s becoming increasingly important for business application owners to lead sustainability initiatives by building application or workload sustainability dashboards for (near) real-time visibility and leveraging predictive optimization tools to reduce the overall digital enterprise’s carbon footprint.
WCO can help provide predictive insights, enabling businesses to optimally place or move workloads based on predicted resource consumption and GHG emissions, balanced with operational constraints like cost and business rules.
To accelerate an enterprise’s journey to net-zero, the Splunk Observability Cloud (SOC) can help build functional models and applications that align with enterprise needs, enabling faster digital go-to-market activities. Cisco’s Customer Experience (CX) or qualified partners can help customers build out WCO and advance their multi-cloud data center sustainability programs.
Next Steps
Sustainability is moving up the boardroom agenda, becoming one of the top priorities for CEOs and CFOs. Everyone within the organization needs to align with corporate net-zero and sustainability goals. Here’s a high-level four-step execution plan:
- Put tools in place to get visibility into the GHG emissions of your applications & associated reporting.
- Identify opportunities for optimization of your application’s GHG emissions.
- Orchestrate optimization (enabled by predictive insights) by leveraging more energy and GHG emissions efficient cloud providers over time.
- Iterate further value-add features, data model extensions, and algorithm refinements.
By following these steps, organizations can make strides in their sustainability efforts and contribute to a more sustainable future.
Ready to make your enterprise more sustainable? Engage with us in the comments below or share your thoughts on social media. Let’s drive the conversation on how we can collectively reduce our impact positive impact on the environment.
Related Links
- How to master your application’s carbon footprint – Part 2/3: Introducing Workload Carbon Optimizer
- How to master your application’s carbon footprint – Part 1/3