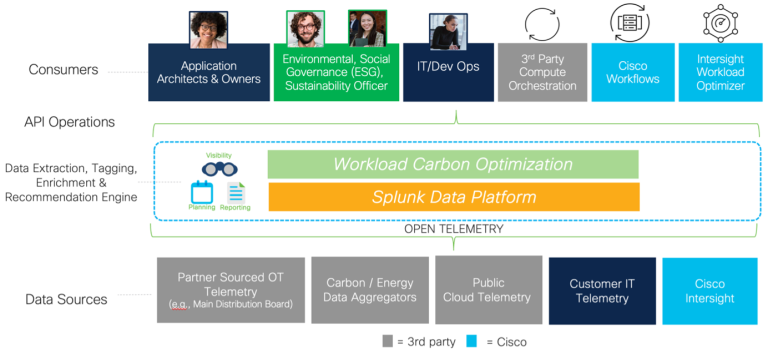
In part 1 of this 3-part blog series, we explored the context and operational constraints involved in understanding the carbon footprint of an organization’s applications deployed in a hybrid cloud environment. If you missed it, you can catch up here. Now, in this second installment, we look at what is needed to improve visibility and optimization.
Developing a WCO Application
Let’s start with the pivotal role of observability in helping organizations evolve from DevOps to “DevGreenOps” – by enabling continuous measurement and improvements of the carbon footprint of its digital services. With corporate environmental sustainability goals in mind, sustainability-minded enterprises are seeking an operationally dynamic balanced placement of workloads based on greenhouse gas emissions (GHG), business affinity or anti-affinity rules, performance, and cost. An observability platform like Splunk Observability Cloud (SOC) can be used to help:
- Collect continuously workload and environmental sustainability metrics as well as metadata
- Create and manage sustainability charts, dashboards, and detectors
- Analyze environmental sustainability metrics (e.g. using Splunk SignalFlow)
- Integrate third-party web services, authentication services, and notification services
By leveraging these capabilities, a WCO can be developed as a logical extension of an observability platform such as SOC. This solution aims to provide near real-time visibility into the carbon footprint of workloads, which can help develop a more sustainable IT operation.
Introducing the WCO
The WCO is a conceptual solution designed to address the complex challenge of workload carbon footprint optimization. WCO would be a Cisco partner- or customer- developed solution that could leverage the Splunk Common Information Model (CIM) and SOC Application Programming Interfaces (APIs) to offer granular per workload GHG emissions information. Here are its core functional capabilities:
- Visibility: Provides near real-time, per-workload carbon footprint information, optionally aggregated into cluster or business service views.
- Reporting: Aggregates and formats data for reporting to different enterprise stakeholders.
- Forecasting and Planning: Utilizes a machine learning engine to calculate optimal carbon footprints for workloads within given operational constraints.
- Corporate Sustainability progress tracking: For companies who have goals to achieve 24/7 carbon-free energy it can help them with matching the purchase of time-based energy attributes certificates (T-EACs).
These capabilities can enable enterprises to:
- Track the workload / application / service current and historical carbon footprint in near real time, offering valuable trend analysis.
- Support energy and GHG emissions optimization reporting for various stakeholders.
- Plan and (optionally) automate optimal workload placements based on their forecasted carbon intensity, respecting operational constraints.

A Real-World Application
Consider an enterprise with data centers spread across multiple locations (on-prem or cloud based). By integrating WCO with for example SOC, the enterprise can translate data from various sources into the Open Telemetry (OTEL) format (Metrics, Events, Logs, Traces – ‘MELT’). This data includes:
- Enterprise Information and Communications Technology (ICT) Telemetry: Compute and storage energy consumption data.
- Cloud Service Provider Telemetry: e.g. Kubernetes cluster information and application observability metrics enabling multi-cloud visibility and optimization.
- Energy Grid Carbon Data Aggregators: Data from sources such as electricitymaps.com.
- Communication Service Providers: Select the most GHG emissions optimized routing paths between data center sites.
By enriching this data with forecasted weather information (typically accurate within a 72-hour window) and business service context, WCO can provide a comprehensive view of the carbon footprint of workloads, enabling the creation of an optimal move schedule to minimize the carbon footprint balanced (weighted) against other technical and business operational constraints.
The WCO being data rich can provide granularity with regards to GHG emissions insights across a MultiCloud IT platform. This in turn provides consumers (listed in Figure 1 above) with a better understanding of future workload placement options agnostic to the infrastructure provider. Most infrastructure providers today provide toolsets that pertain to their own service offering and / or provide some software tools rather than a solution to the Multicloud operational challenge.
Personas Benefiting from WCO
- Application/Business Service Owners: Can gain visibility of the carbon footprints of specific application and business services.
- DevOps, Site Reliability Engineering (SRE)/Developers: Focused on minimizing GHG emissions by line of code (aka green coding) and environmental sustainability improvements, they can use energy consumption and GHG emissions data as a key metric in their continuous improvement feedback loops.
- Environmental, social, and governance (ESG) Sustainability Officers/Senior Executives: Gain transparency for environmental sustainability reporting and disclosures, aiding in net zero goal demonstrations.
- Procurement Teams: Support sustainability goals by leveraging WCO Dashboard reports to document a GHG emissions baseline that can be shared with suppliers in Requests for Information (RFIs) or Requests for Pricing (RFPs).
As we wrap up this discussion on the conceptual and functional aspects of the WCO, we encourage you to share your thoughts and insights. How do you envision the impact of such solutions on your organization’s sustainability goals? Let’s spark a discussion and explore the potential of WCO together.
Stay tuned for the final part of this blog series, where we will dive into the technical design and architecture of the ‘Workload Carbon Optimizer,’ validated by Cisco’s own internal proof of concept.
We’d love to hear your feedback and ideas. Comment below or share this blog on social media to keep the conversation going.
Related Links
- How to master your application’s carbon footprint – Part 3/3: WCO – Functional Design Architecture
- How to master your application’s carbon footprint – Part 1/3